Introduction
Design Method
Research & Analysis
Design & Prototype
User Testing

The All New Jaguar Car-App

A Mobile App for Android Devices.

For Music, Maintenance & Self Driving Modes

Goal

The challenge was to create the first Jaguar mobile app that could replace many of the electronic components in the car, such as the radio and alert LCD lights, with the user’s mobile phone, as well as act as a device that could interact with the drivers autonomous driving modes from both inside the car and outside the car. The mobile app would also be designed as a replacement for the user’s manual.

Result

The resulting app was a pure success. The Jaguar app is still featured on the Adobe XD web page and is one of the most viewed apps on Behance. This app also received praise for a Jaguar car dealer. This was the first time that motion graphics was used in a mobile app and user testers said they preferred the motion graphics interface over the past static user interfaces they tested.
The process that is used to create the “All New Jaguar Car-App” revolved around the concept of the UX Wheel. The process is made up the three phases that can be viewed below.

Phase 1 - Research & Analysis

The research and analysis phase is where learning about the product takes place. It is where the team figures out who the target market is. This phase is also used to figure out what information is most pertinent to the architecture of the website. To accomplish this case studies were read from similar projects created by design agencies.  Ethnocentric research was also utilized to come up with new ideas for the mobile app as well.

Phase 2 - Design & Prototyping

The design and prototyping phase is where the creation of wireframes and animated prototypes are created.

Phase 3 - User Testing & Measurement

The user testing phase is where the prototype simulation is tested out for issues by 5 users using various testing techniques. Most importantly the testing method called “Over the Shoulder Observational” testing.

Research & Analysis - (Phase 1)

Interviews

To begin the research phase I had several conversations with several car owners to find out how they felt a new mobile app could help them inside of their cars. I also visited some car dealerships and asked some car dealers how they felt the mobile apps could help someone who has purchased a new Jaguar.

Embedded Research

When I drove my own car, I observed different situations where I could use a mobile app to help me out the most. One night, I had a situation where one of the lights went off on the dashboard of my car and I did not know what it meant. I had to pull the user’s manual out of the glove compartment and spend about 20 minutes on the side of the road figuring out what the light meant. At that moment, I realized that was a perfect time saving user experience feature that could be added to the new Jaguar Mobile App.

Observational Research

I spent some time sitting in the park, the gym, and even observing marathons to get a sense of what people did and did not enjoy about exercising. This also gave me the opportunity to ask a runner questions immediately after a run regarding how to better enhance the exercise experience using a mobile app.

Google Search

The google search engine was a great tool for looking up all different types of research information. For example I used Google to learn more about organized run clubs, I used it research the list of top fitness mobile apps that existed on the current market and countless other information.

Marketing Research

I used case studies from design agencies that offered free case studies and from work on previous car apps to learn more about the target users that the mobile app would cater to.

Personas

For this project, I learned that the Personas that I was catering too were the well to do 35 to 54 year old drivers. This is based on a free case study provided by the Internet Advertising Bureau called "CASE STUDY: Engaging Jaguar fans with mobile advertising."

Affinity Diagram

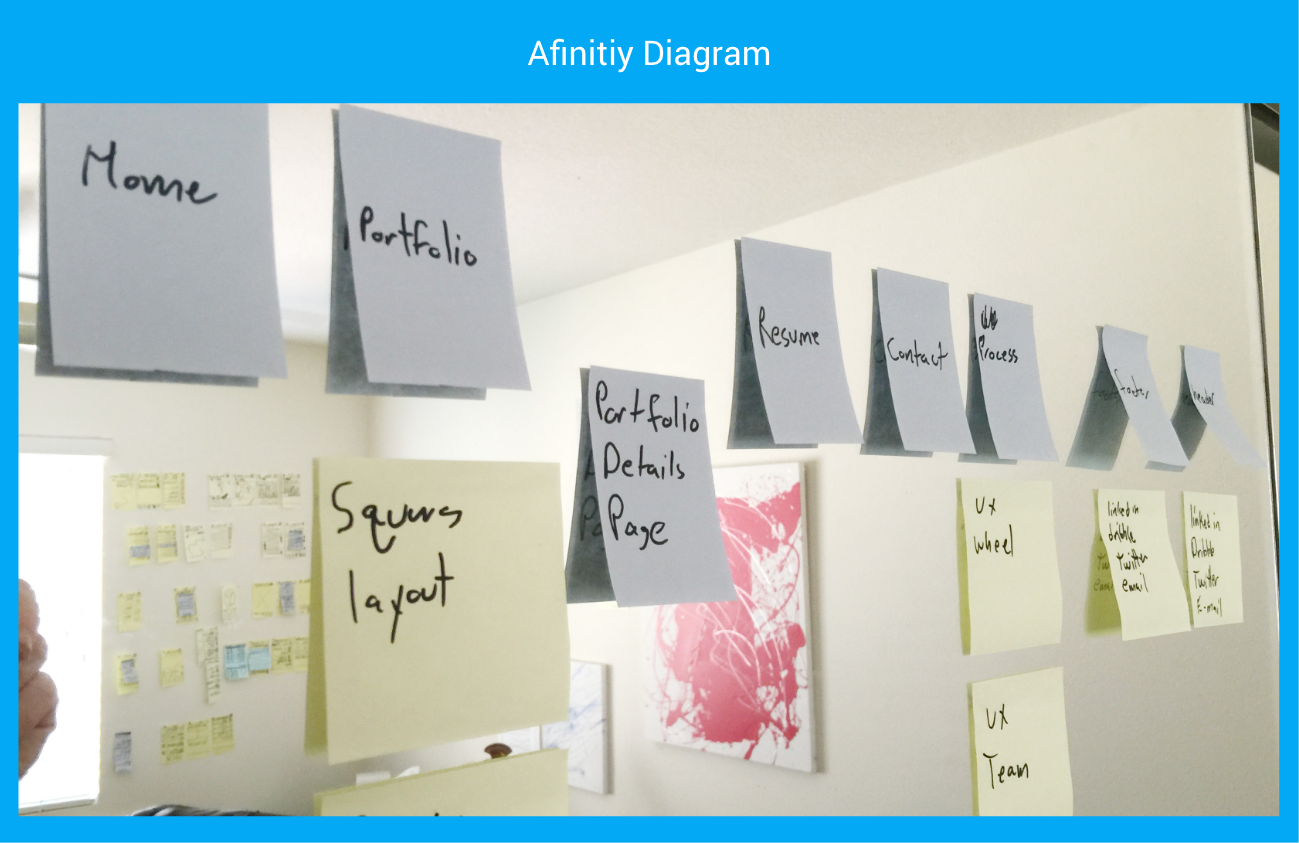
After I felt I had achieved some really good research, as well as a really good idea of how I wanted to create a solution for a new Jaguar mobile app I came back to the studio and began creating an affinity diagram. I began creating the affinity diagram by imagining myself using an imaginary mobile app. For each step of the mobile app that I imagined myself clicking through I placed a blue colored Post-it on the wall. For any additional ideas that I wanted to add to an already existing page such as photographs, illustrations, icons, layout style, etc., I place a yellow Post-it on the wall directly below the initial page. Lastly I went back and placed all of the items from the affinity diagram in order of greater importance to least importance.

Site-Map

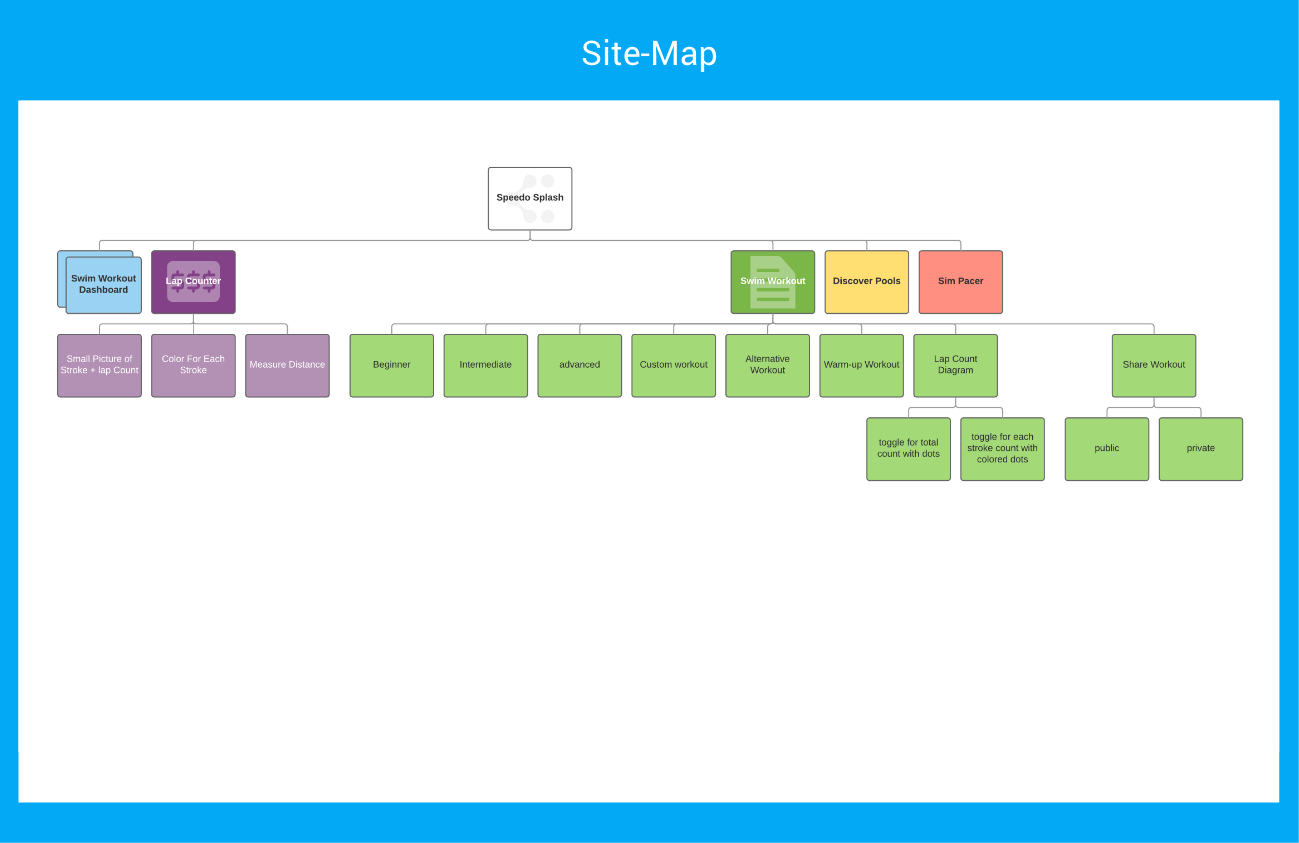
After the affinity diagram has been created I converted the diagram directly over into a Site-Map software called Lucid charts. The affinity diagram easily converted into a Lucid charts site-map that could be constantly modified as additional work was completed throughout the iteration process of the UX Wheel.

Scenario Sketch Videos

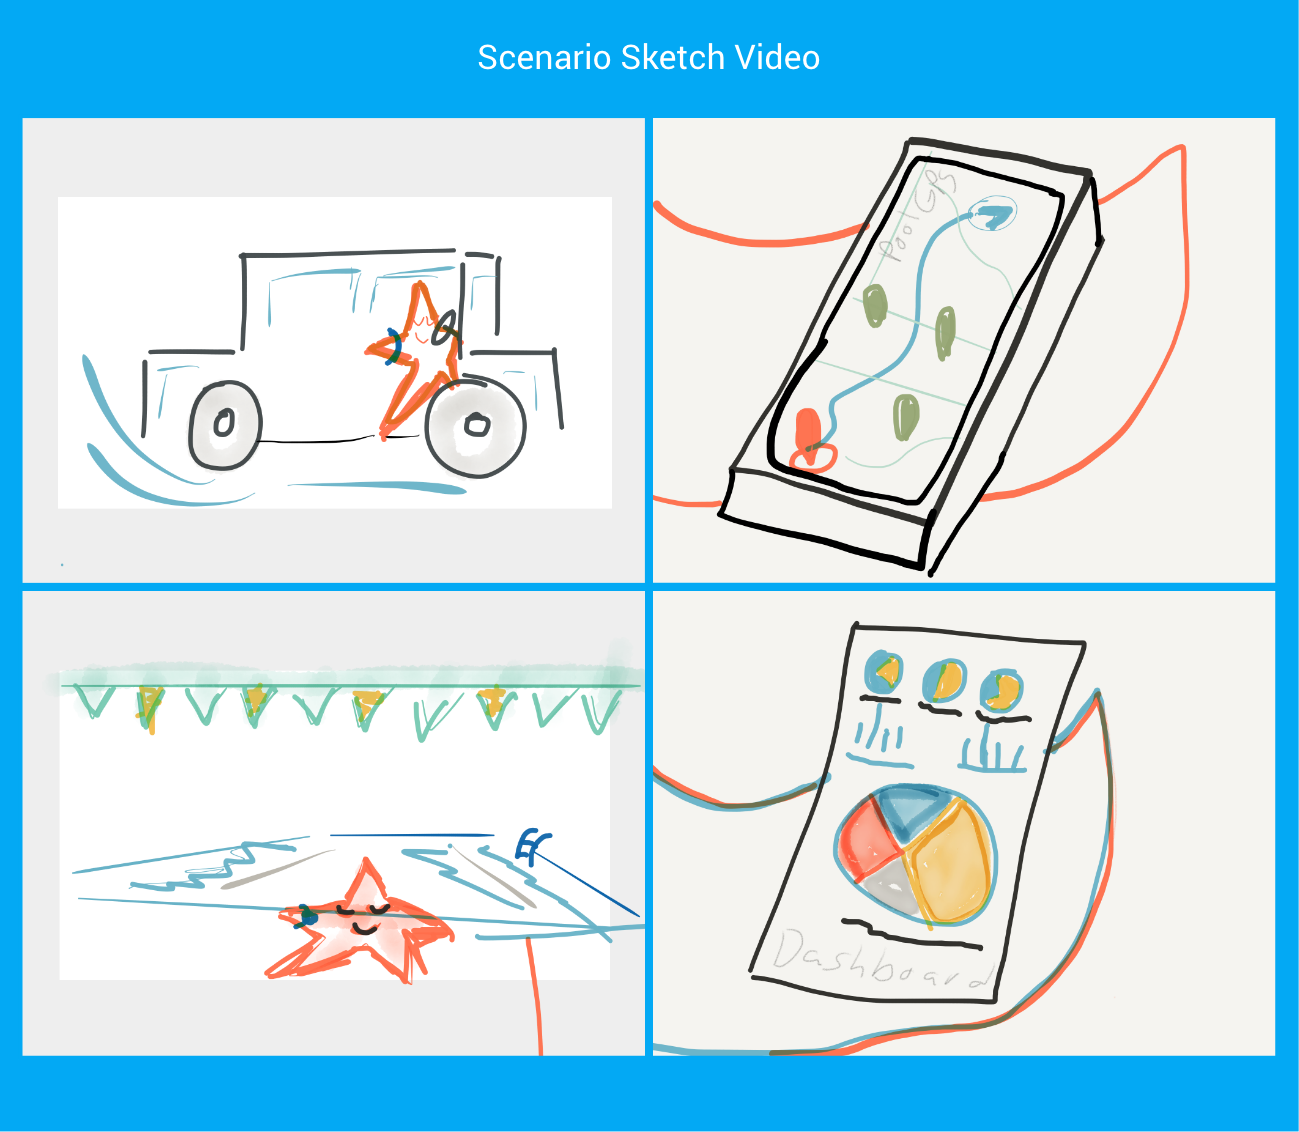
I went on to make scenarios storyboard videos. My scenario storyboard videos consisted of a little small cartoon character that I draw of a star that is placed in various scenarios simulating how a user would use the new exercise mobile app. When all of the storyboards were completed I placed each of the storyboards into a video program called Adobe Voice. I than added voice over to each of the storyboards. Next I presented the videos to people outside the UX Team. I sat and observed the the viewers as they viewed the scenario videos and wrote down any ,ideas, errors or mistakes that the viewers found. The new ideas were added to the existing site-map.

Arrange By Priority

Next I went back and arranged the ideas on my site-map from most important to least important.

Workflow Diagram

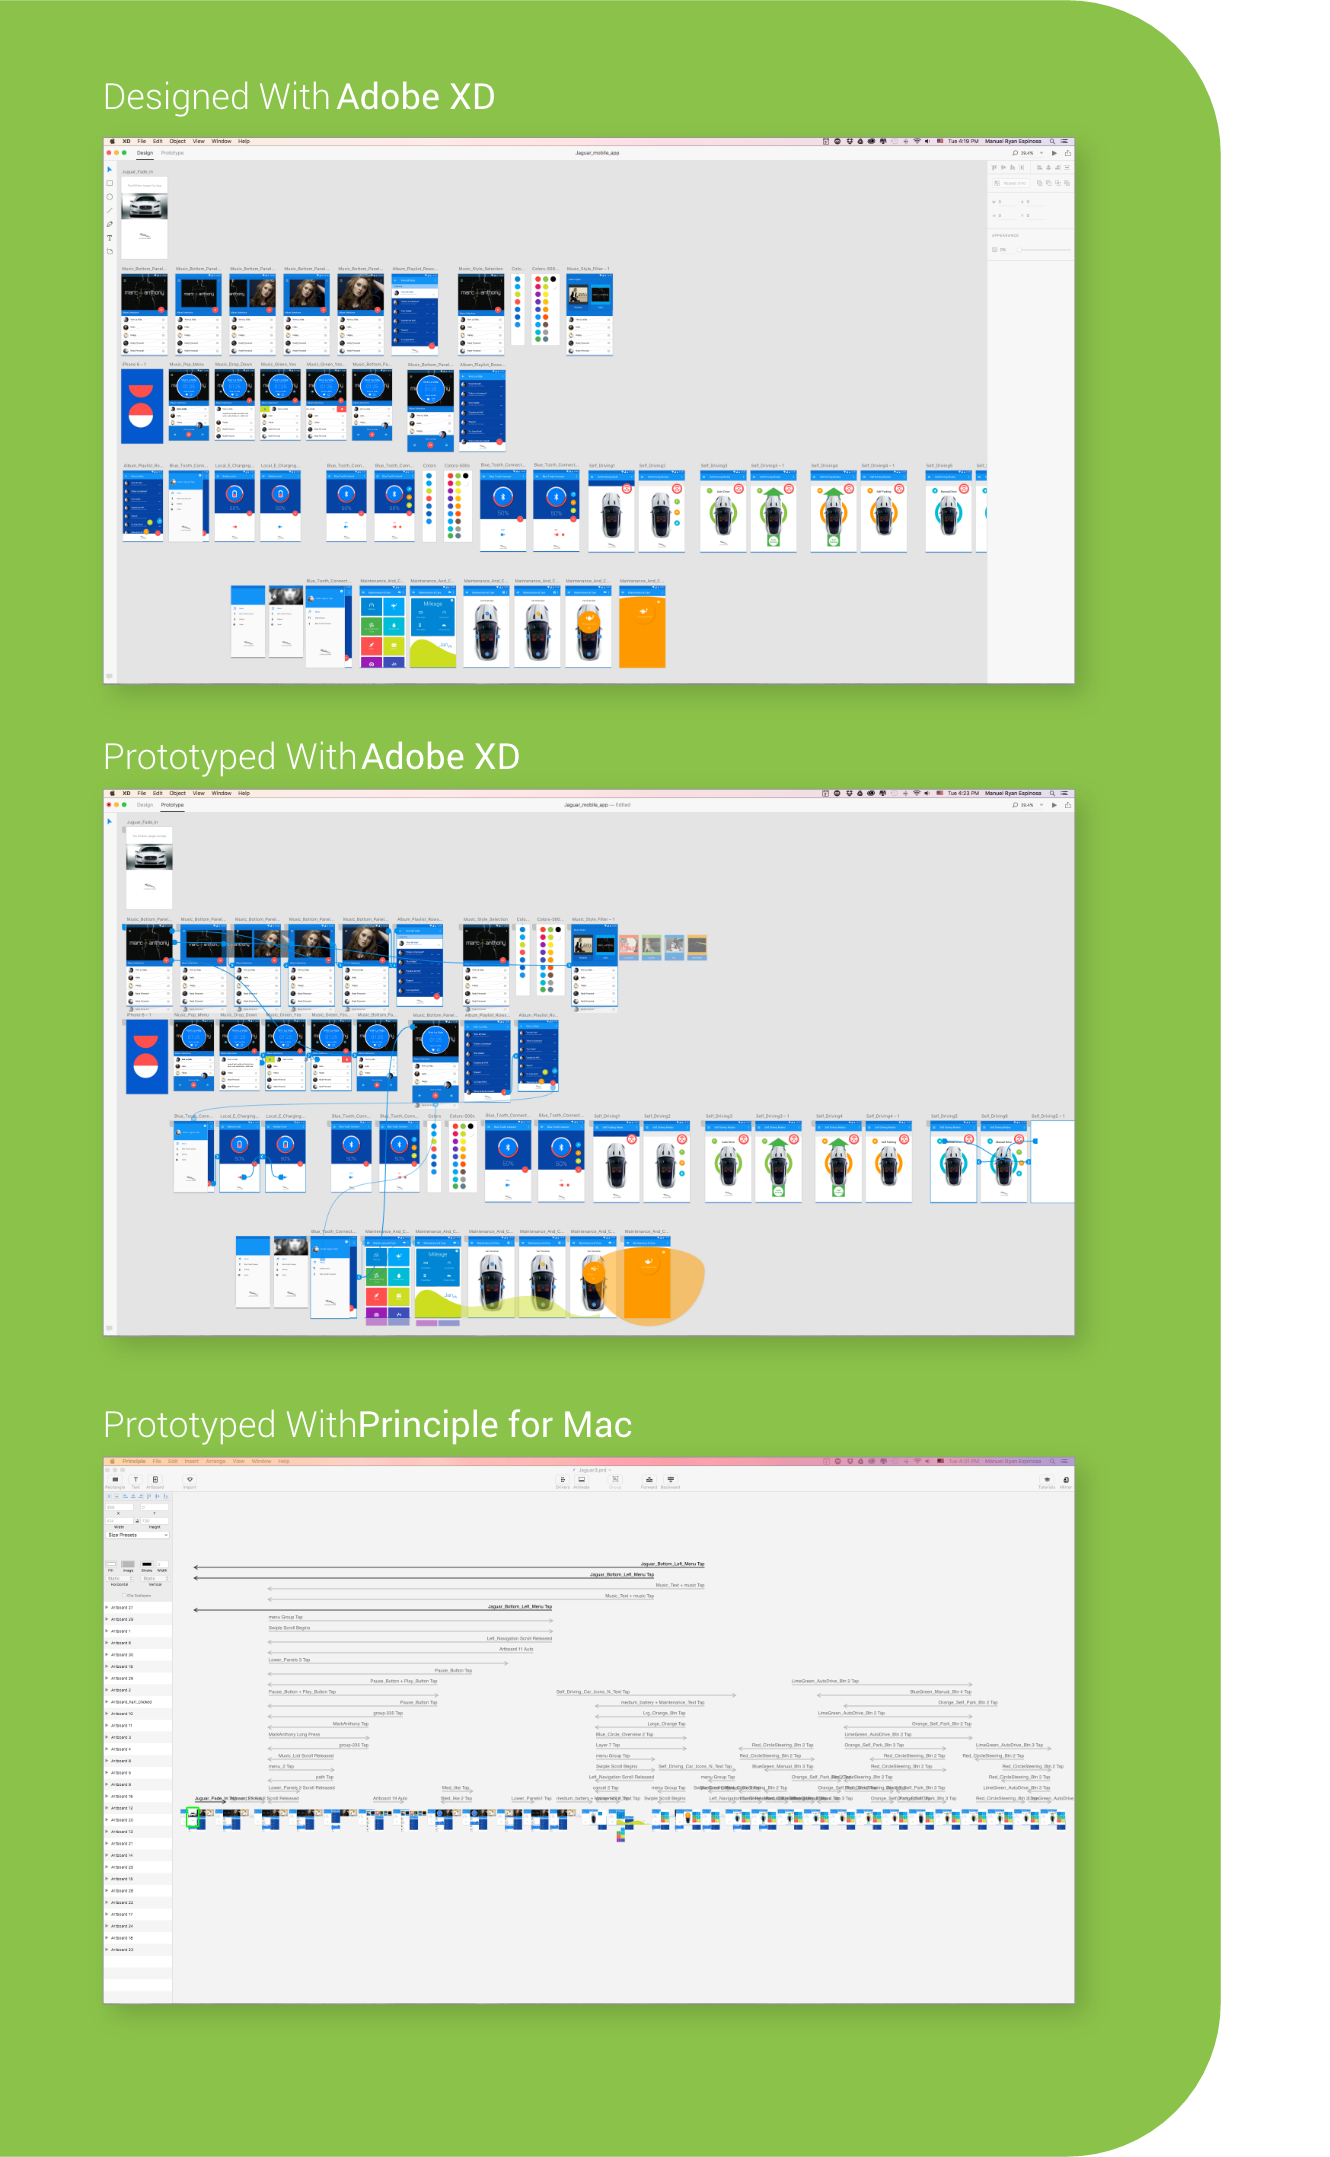
Lastly I created workflow diagram using low-fidelity wireframes that were stitched together in Adobe XD and quickly prototyped to convey the new research ideas to the “Design & Prototype” team.

Design & Prototyping - (Phase 2)

Low-Fidelity Sketches

Low fidelity wireframes were quickly created to create a rapid prototype for the site-map layout. In the past I used hand drawn white board sketches or sketch pad drawings as low fidelity wireframes. However, for this project I was comfortable directly creating low fidelity wireframes using Adobe XD. I was able to create a rough draft of the entire app within about 3 hours. Including a live and complete prototype that I could share on the web with the marketing team to confirm the marketing specifications.

Hi-Fidelity Wireframes

The high fidelity wireframes were created to depict the pixel perfect look and styling that would be used for the actual mobile app prototype.

Hi-Fidelity XD Prototype

As the high-fidelity wireframes are being created I was able to simultaneously create a high-fidelity artboard to artboard style prototype in Adobe XD. This style of prototype was viewed by the entire UX team and modified until the entire look was agreed upon.

Hi-Fidelity Micro-Animation Prototype

A high-fidelity micro-animation style motion graphic prototype was created in the more advanced motion graphic prototype tool called "Principle for Mac." This final Principle style prototype was created and placed on a real mobile phone to simulate a real mobile app and used by user testers in the final testing and measurement phase of the UX Wheel.

User Testing & Measurement - (Phase 3)

About The Final User Testing & Measurement

For this phase I did observational over the shoulder user testing with five user testers. The reaction that I received from the user testers was extremely positive. I found several small issues that were found to be real issues and they were reintroduced back into the UX Wheel for re-evaluation. After modifications were made to increase the simplicity of the mobile app, and issues were proven to work smoothly, the UX Team came to the final conclusion that the app was complete.

Over the Shoulder User Testing Explained

The style of testing depicted in the graph above is called “Over the Shoulder Observational User Testing”.  This style of user testing relies of 5 user testers. 5 User testers are taken to the gym or somewhere else consistent with the natural environment where they would actually be using the mobile app. The UX team or UX individual would then walk each of the users testers through the usage of the mobile app for specific scenarios. A member of the UX team would then watch over the shoulder of the user for any mistakes or issues that the user has along his testing journey.  After all of the user testers have been tested and all of the mistakes and issues discovered, the person looking over the user testers shoulder looks at the data.  If the UX tester observes that three of the 5 user testers made the same mistake than the UX team will consider this a real issue and the issue is reintroduced back into the “Research & Analysis” phase of the UX Wheel for re-evaluation. However, if only two or one of the user testers make a similar mistake than these mistakes are not considered real issues, and these mistakes are not reintroduced back into the UX Wheel for “Research & Analysis”.

This is how over the shoulder observational user testing is done. Statistically if this process is done correctly and all of the main issues are figured out and make it through all 5 of the user testers successfully, than 85% - 90% of all targeted user personas will be able to comfortably use the new mobile app. This will also allow for a longer overall product usage time before a new redesign of the product is necessary.

The mobile app can be pushed even further to obtain the last 10% - 15% of the users that will be using the product by using analytic tools such as A/ B testing, Google Analytics and a plethora of many other new tools and techniques that are being invented every year.
Manuel Ryan Espinosa, MHCID
Product Designer

Portfolio

Circuite Express
Sample of Interaction Design.
Jaguar
Sample of Interaction Design.
Social Spring
Sample of Interaction E-commerce Design.
Fullerton College Theater App
Sample of Interaction Design.
Ducks Apple Watch App
Sample of Interaction Design.
Jaguar
Sample of Interaction Design.
Social Spring
Sample of Interaction E-commerce Design.
Fullerton College Theater App
Sample of Interaction Design.
27 Tennessee, Irvine, CA 92606mico@nolimitsgallery.comCell 949.278.0625