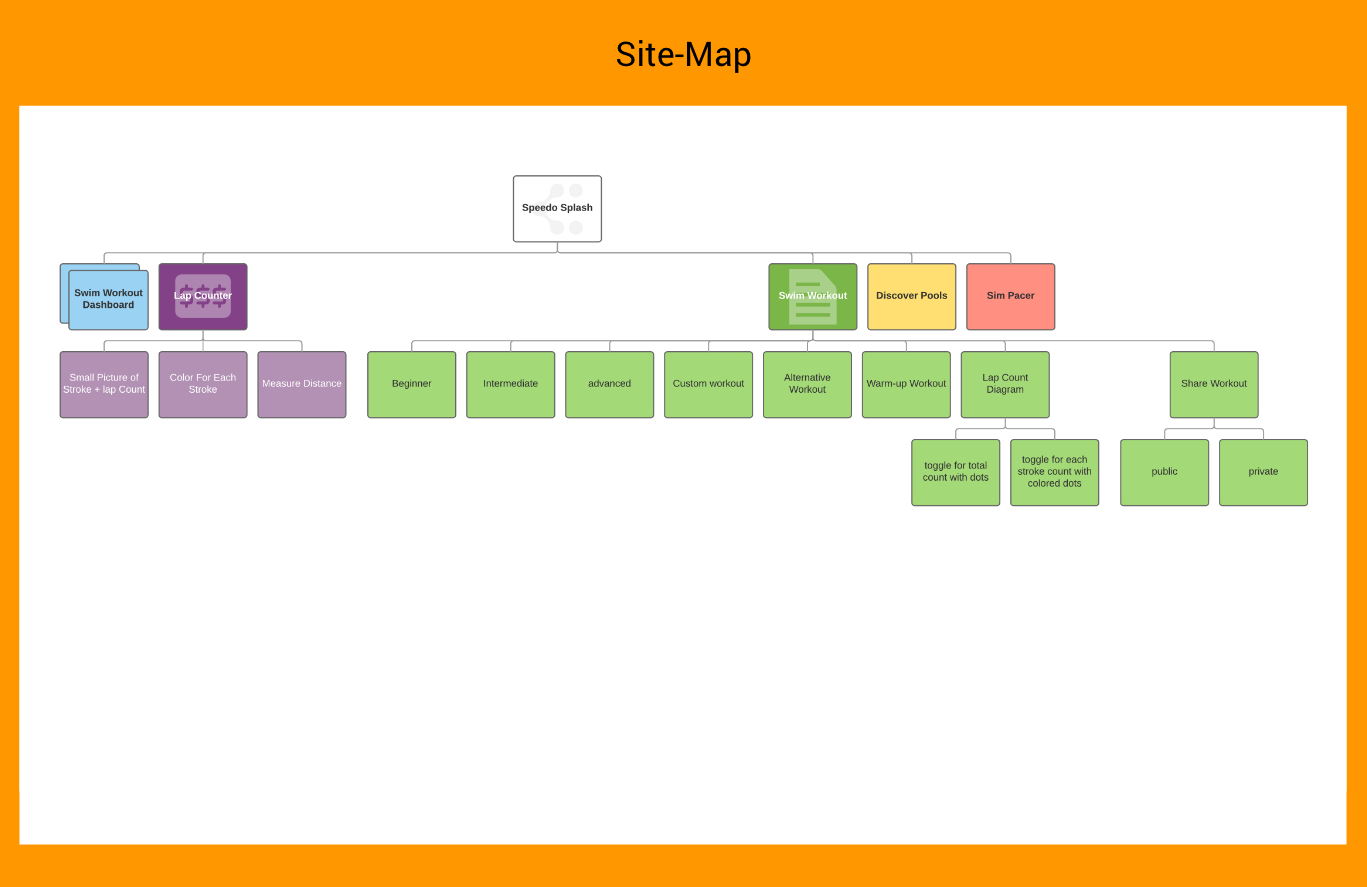
Introduction
Design Method
Research & Analysis
Design & Prototype
User Testing

Circuit Express

A Mobile App for Android Devices.

Lose Weight & Increase Your Metabolism

Goal

The challenge of this mobile app is to help users lose weight through exercise and by counting their caloric count.

Result

The resulting app was an app that introduced the opportunity for users to create new workout circuits by converting the entire city they live in to a gym. By using the mobile app the users could create their own workout circuits that would take them to various parks, gyms and swimming pools, etc. The users could also share their circuits with friends and even use pre-existing circuits that were randomly created by other users in their area. The mobile app also comes with a caloric counter that will help the users monitor their diet throughout the day to help assist the user even more with a steady weight loss.

Phase 1 - Research & Analysis

The research and analysis phase is where learning about the product takes place. It is where the team figures out who the target market is. This phase is also used to figure out what information is most pertinent to the architecture of the website. To accomplish this I studied case studies from similar projects created by advertising agencies and used various ethnocentric research methods to come up with new ideas for the mobile app.

Phase 2 - Design & Prototyping

The design and prototyping phase is where the wireframes and the motion graphic prototypes are created.

Phase 3 - User Testing & Measurement

The user testing phase is where the prototype simulation is tested out for issues by 5 users using various testing techniques. Most importantly the testing method called “Over the Shoulder Observational” testing.

Research & Analysis - (Phase 1)

Interviews

To begin the research I went out and interviewed several runners as well as non-athletes, various questions for ideas regarding how to come up with a way to make working out more enjoyable.

Embedded Research

To learn more about the workout experience I went out running with various run clubs, I ran at various 24 hour fitness locations and I ran through local parks and sidewalks.

Observational Research

I spent some time sitting in the park, the gym, and even observing marathons to get a sense of what people did and did not enjoy about exercising. This also gave me the opportunity to ask a runner questions immediately after a run regarding how to better enhance the exercise experience using a mobile app.

Google Search

The google search engine was a great tool for looking up all different types of research information. For example I used Google to learn more about organized run clubs, I used it research the list of top fitness mobile apps that existed on the current market and countless other information.

Marketing Research

I used marketing research from advertising agencies that offered free case studies and that worked on other exercise apps to learn more about the target fitness market that they were after and also to view if their target market was a success or failure. Here is one case study that I used to find out the best target personas to go after and design the mobile app for.

http://www.mobyaffiliates.com/blog/health-and-fitness-apps-promotional-methods-catching-the-wave-of-new-year-resolutions/

Personas

For this project the personas were researched using case studies from other companies working on similar projects. What was discovered was that companies like Spotify new “Spotify Running” mobile app was able to push for older persona audiences by creating advertising campaigns that catered specifically to the non youth users. Therefore pushing the market and expanding the user base. The way this was done was by advertising on television shows and youtube videos that featured Jay Leno and Jimmy Fallon. The target persona range was figured out to be from 25 - 50 years old. This range of users is also known as the Generation Y and the Generation X users.

Site-Map

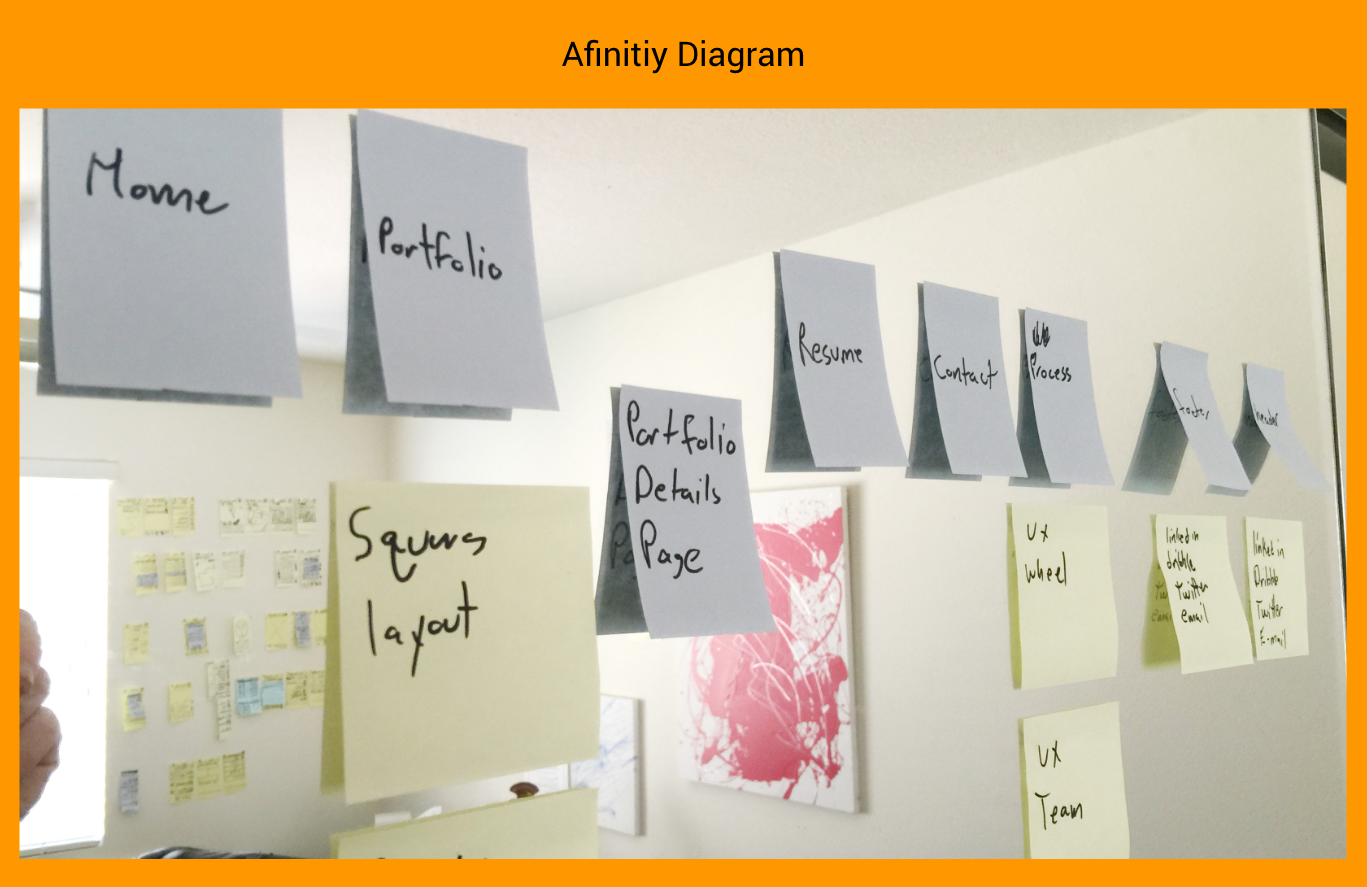
After the affinity diagram has been created I converted the diagram directly over into a Site-Map software called Lucid charts. The affinity diagram easily converted into a Lucid charts site-map that could be constantly modified as additional work was completed throughout the iteration process of the UX Wheel.

Scenario Story

A scenario story was used to quickly put down my thoughts for a how a user could use the mobile app before any sketches were even created.

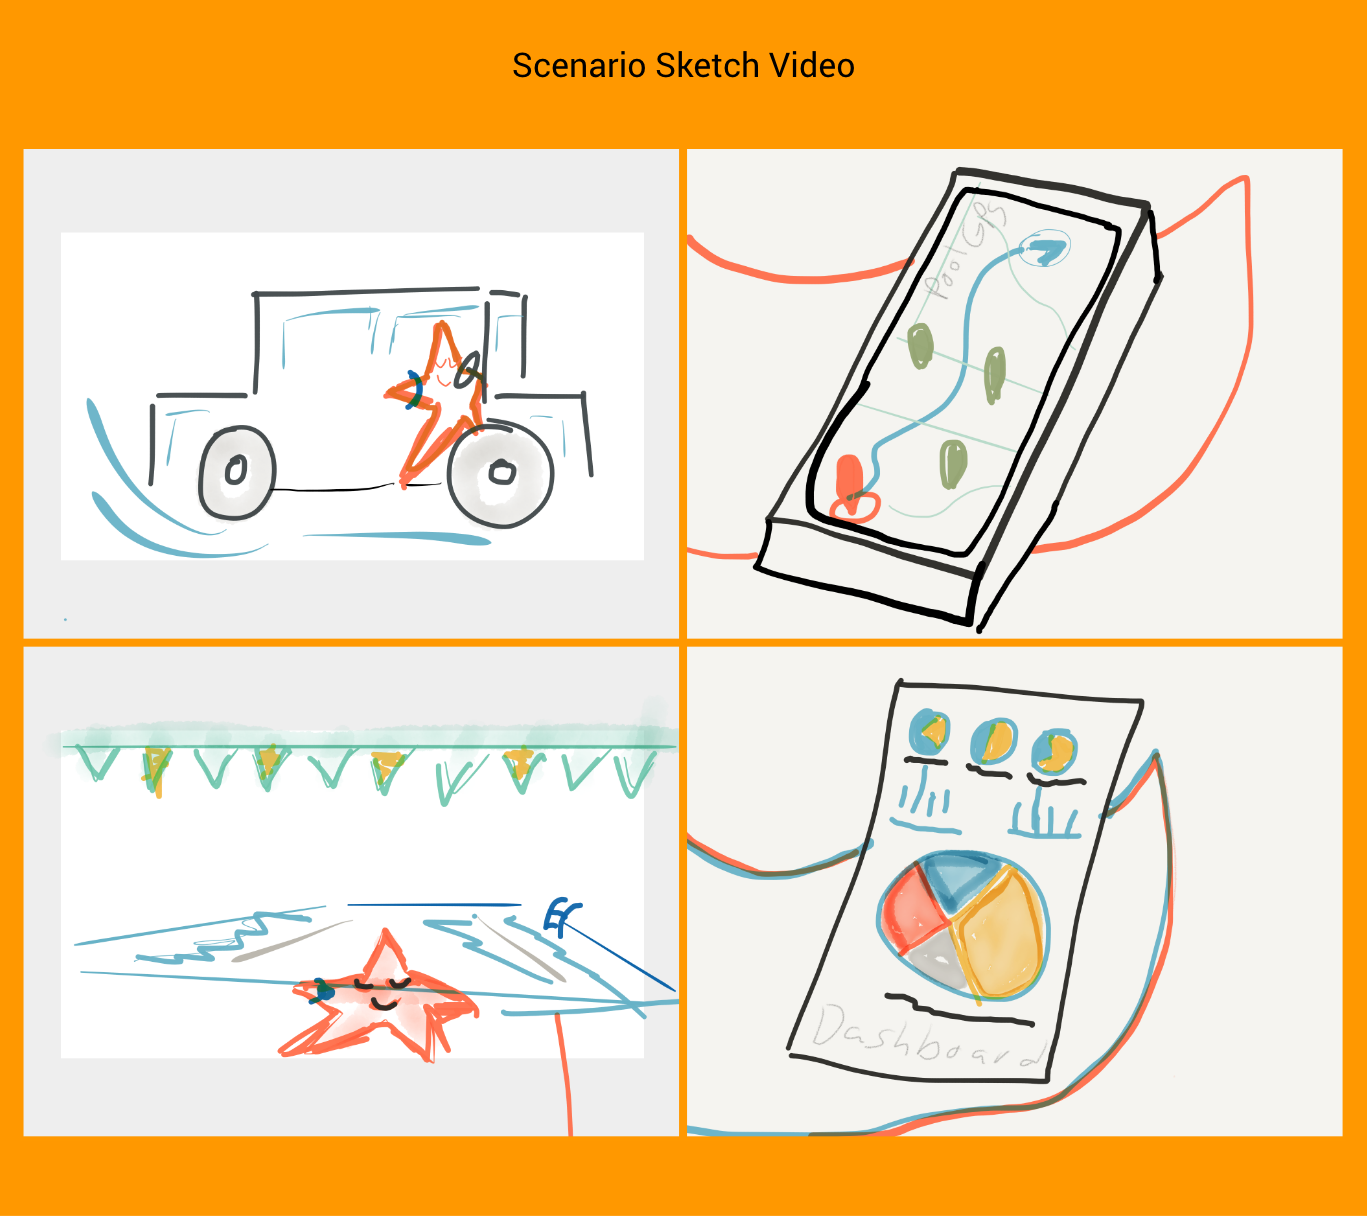
Scenario Storyboard Videos

I went on to make scenarios storyboard videos. My scenario storyboard videos consisted of a little small cartoon character that I draw of a star that is placed in various scenarios simulating how a user would use the new exercise mobile app. When all of the storyboards were completed I placed each of the storyboards into a video program called Adobe Voice. I than added voice over to each of the storyboards. Next I presented the videos to people outside the UX Team. I sat and observed the the viewers as they viewed the scenario videos and wrote down any ,ideas, errors or mistakes that the viewers found. The new ideas were added to the existing site-map.

System Map

The system diagram is a diagram that shows specifically how the processes flow
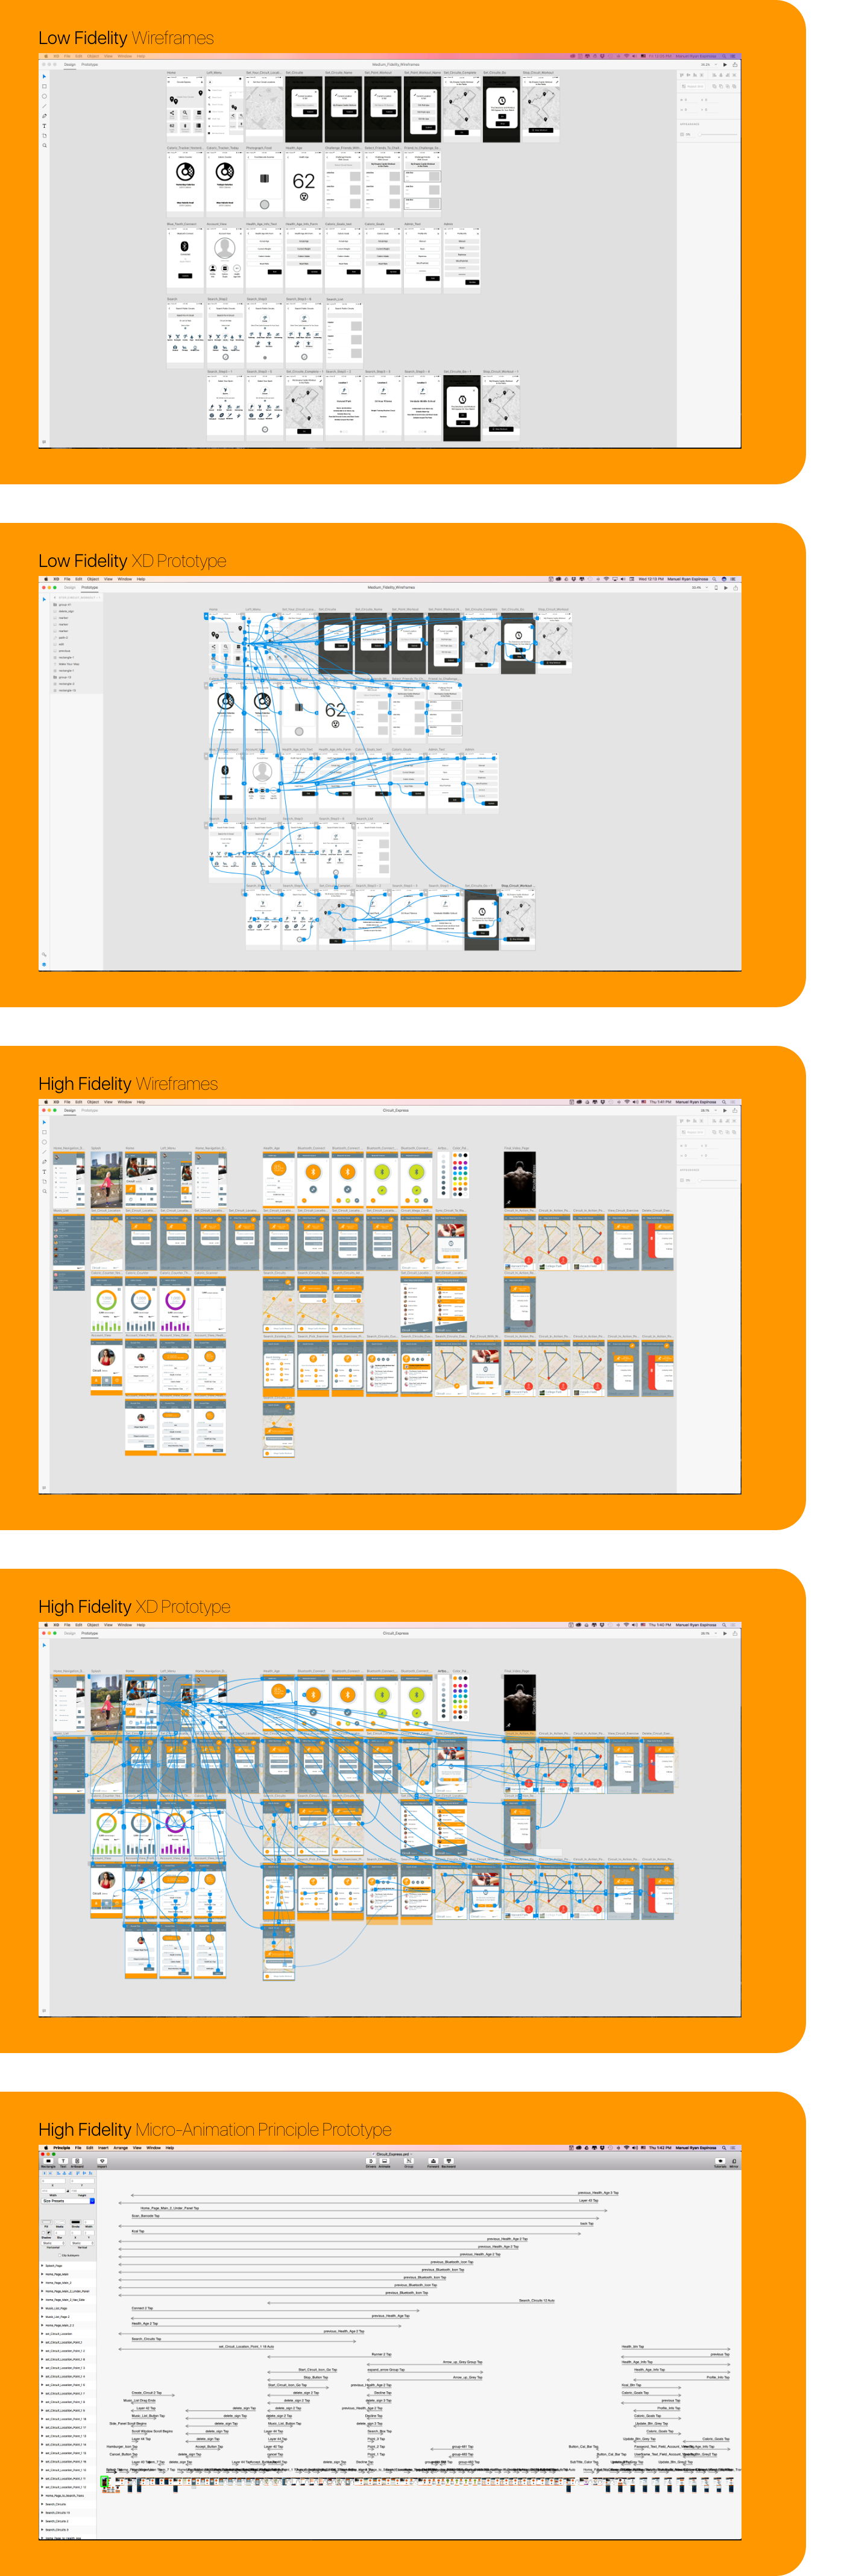
Workflow Diagram

Lastly I created workflow diagram using low-fidelity wireframes that were stitched together in Adobe XD and quickly prototyped to convey the new research ideas to the “Design & Prototype” team.

Arrange By Priority

Next I went back and arranged the ideas on my site-map from most important to least important.

Design & Prototyping - (Phase 2)

Low-Fidelity Sketches

These are the style of low fidelity wireframes that I used to quickly create a rapid prototype for the site-map layout. In the past I used hand drawn white board sketches or sketch pad drawings as low fidelity wireframes as well. However, for this project I was comfortable directly creating low fidelity wireframes using Adobe XD. I was able to create a rough draft of the entire app within about 3 hours. Including a live and complete prototype that I could share on the web with the marketing team to confirm the marketing specifications.

Hi-Fidelity Wireframes

The high fidelity wireframes were created to depict the pixel perfect look and styling that would be used for the actual mobile app prototype.

Hi-Fidelity XD Prototype

As the high-fidelity wireframes are being created I was able to simultaneously create a high-fidelity artboard to artboard style prototype in Adobe XD. This style of prototype was viewed by the entire UX team and modified until the entire look was agreed upon.

Hi-Fidelity Micro-Animation Prototype

A high-fidelity micro-animation style prototype was created in the more advanced motion graphic prototype tool called “Principle for Mac.” This final Principle style prototype was created and placed on a real mobile phone to simulate a real mobile app and used by user testers in the final testing and measurement phase of the UX Wheel.

User Testing & Measurement - (Phase 3)

About The Final User Testing & Measurement

For this phase I did observational over the shoulder user testing with five user testers. The reaction that I received from the user testers was extremely positive. I found several small issues that were found to be real issues and they were reintroduced back into the UX Wheel for re-evaluation. After modifications were made to increase the simplicity of the mobile app, and issues were proven to work smoothly, the UX Team came to the final conclusion that the app was complete.

Over the Shoulder User Testing Explained

The style of testing depicted in the graph above is called “Over the Shoulder Observational User Testing”.  This style of user testing relies of 5 user testers. 5 User testers are taken to the gym or somewhere else consistent with the natural environment where they would actually be using the mobile app. The UX team or UX individual would then walk each of the users testers through the usage of the mobile app for specific scenarios. A member of the UX team would then watch over the shoulder of the user for any mistakes or issues that the user has along his testing journey.  After all of the user testers have been tested and all of the mistakes and issues discovered, the person looking over the user testers shoulder looks at the data.  If the UX tester observes that three of the 5 user testers made the same mistake than the UX team will consider this a real issue and the issue is reintroduced back into the “Research & Analysis” phase of the UX Wheel for re-evaluation. However, if only two or one of the user testers make a similar mistake than these mistakes are not considered real issues, and these mistakes are not reintroduced back into the UX Wheel for “Research & Analysis”.

This is how over the shoulder observational user testing is done. Statistically if this process is done correctly and all of the main issues are figured out and make it through all 5 of the user testers successfully, than 85% - 90% of all targeted user personas will be able to comfortably use the new mobile app. This will also allow for a longer overall product usage time before a new redesign of the product is necessary.

The mobile app can be pushed even further to obtain the last 10% - 15% of the users that will be using the product by using analytic tools such as A/ B testing, Google Analytics and a plethora of many other new tools and techniques that are being invented every year.
Manuel Ryan Espinosa, MHCID
Product Designer

Portfolio

Circuite Express
Sample of Interaction Design.
Jaguar
Sample of Interaction Design.
Social Spring
Sample of Interaction E-commerce Design.
Fullerton College Theater App
Sample of Interaction Design.
Ducks Apple Watch App
Sample of Interaction Design.
Jaguar
Sample of Interaction Design.
Social Spring
Sample of Interaction E-commerce Design.
Fullerton College Theater App
Sample of Interaction Design.
27 Tennessee, Irvine, CA 92606mico@nolimitsgallery.comCell 949.278.0625